
Crevano · Templates · Report Page Templates
Report Page Templates
16 drop-in pages for a document you have already started — the org chart, the timeline, the SWOT grid, the executive summary, the table of contents. All 8.5 × 11, none of them carrying a photograph, so a page lands inside your brand instead of arguing with it.
| Trim size | 8.5 × 11 in |
|---|---|
| Bleed | none · 0.125 in |
| Resolution target | 300 DPI |
| Templates | 16 |
| Pages | 16 |
No templates match that.
Report page templates (16)
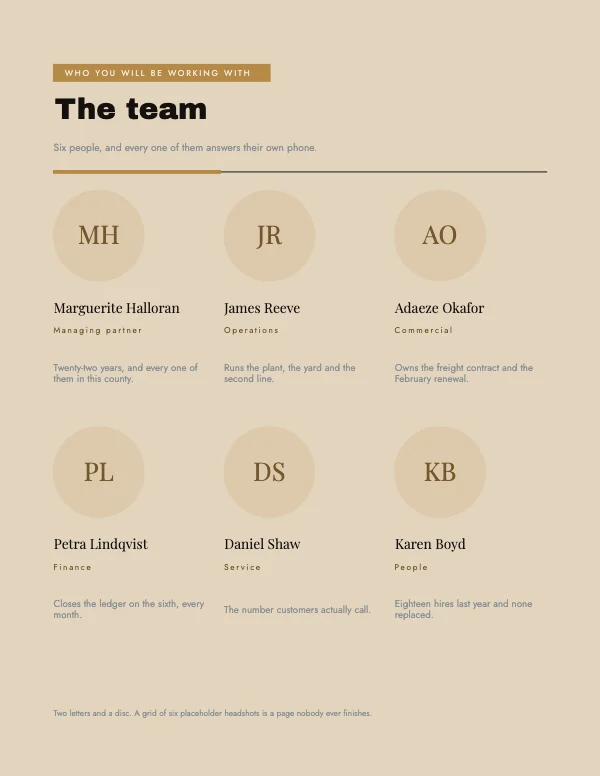 Team Grid BlockPro
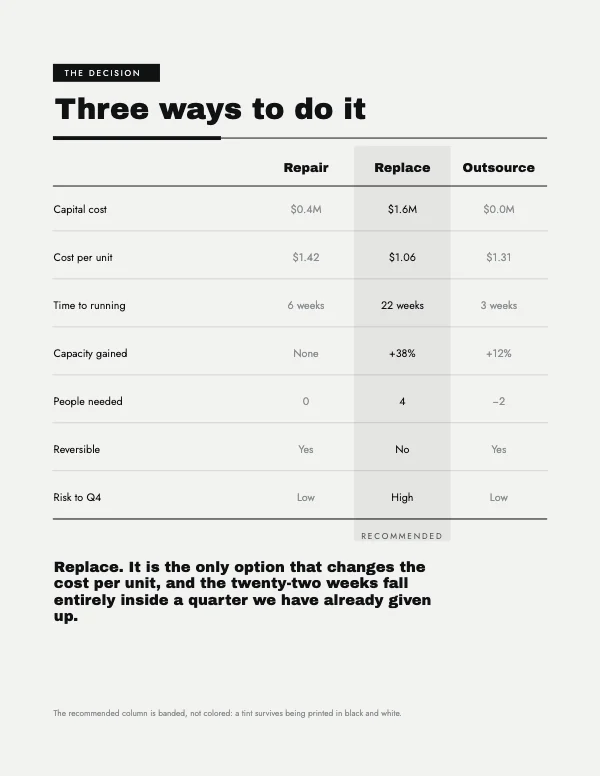 Comparison Table Block
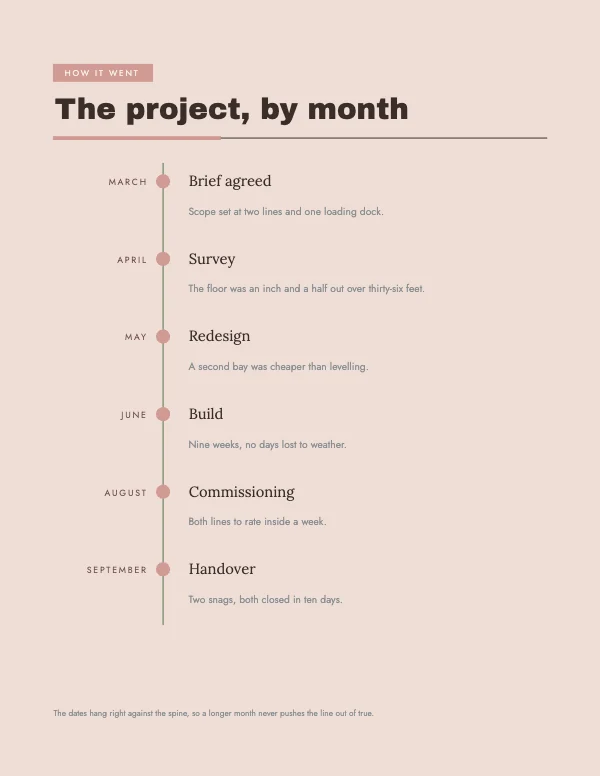 Vertical Timeline BlockPro
 Contact and Next Step BlockPro
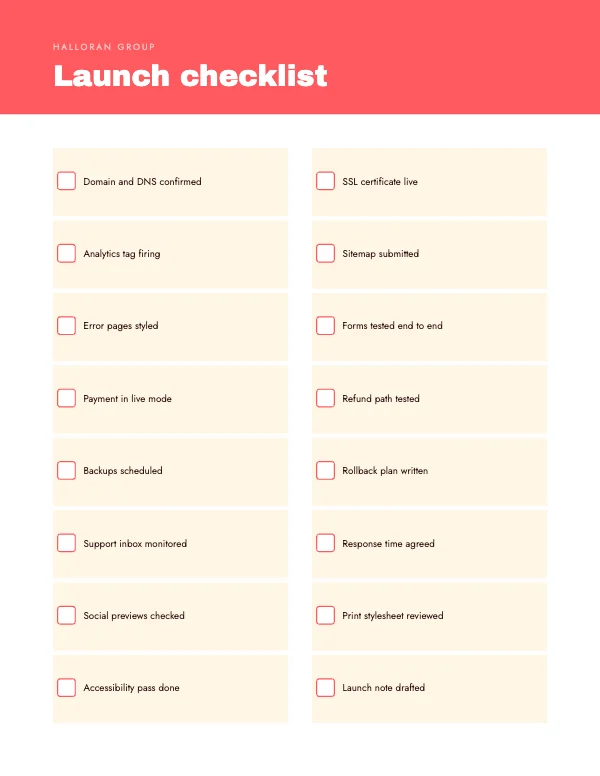 Checklist Block
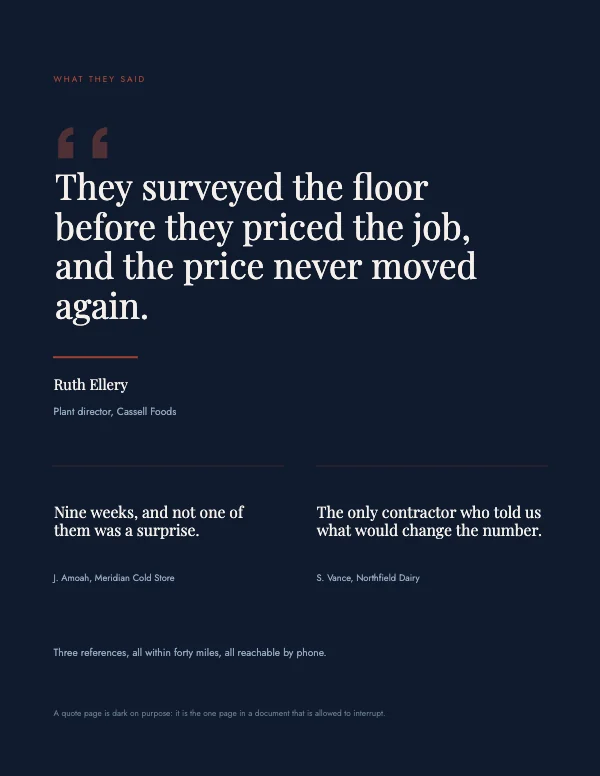 Quote and Testimonial Block
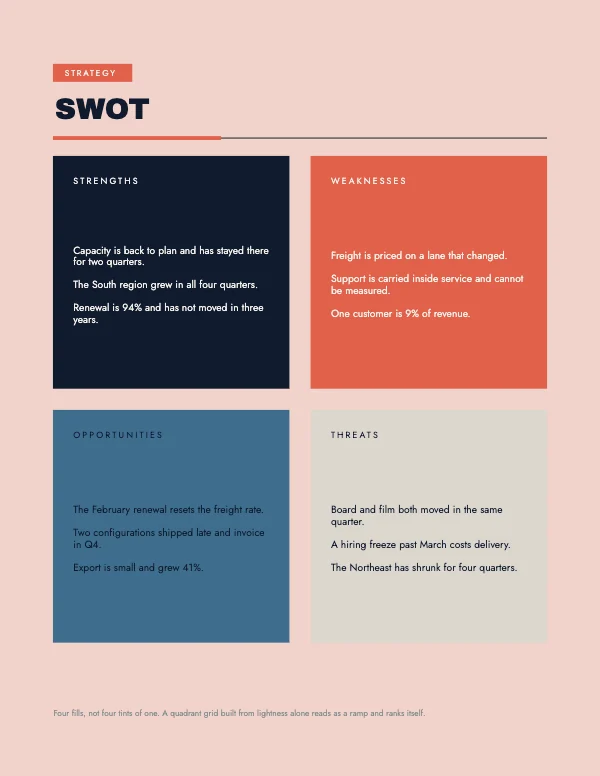 SWOT Analysis BlockPro
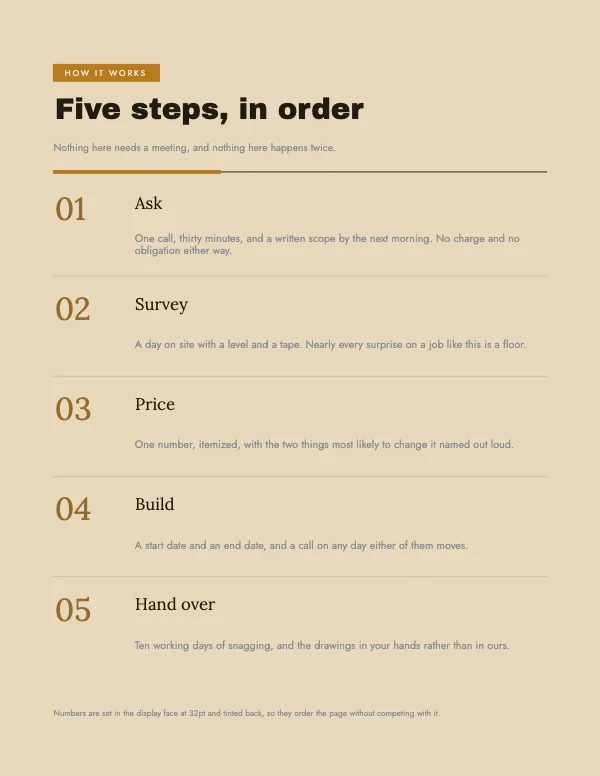 Five Step Process BlockPro
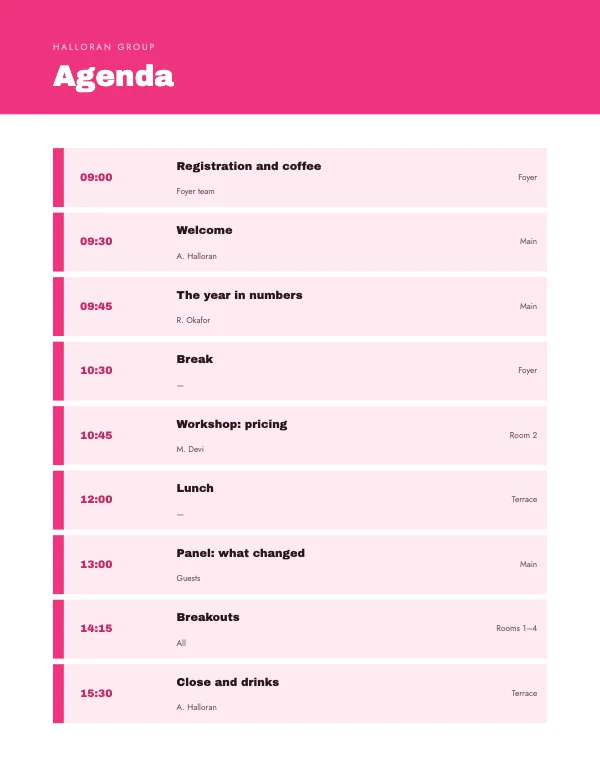 Agenda Block
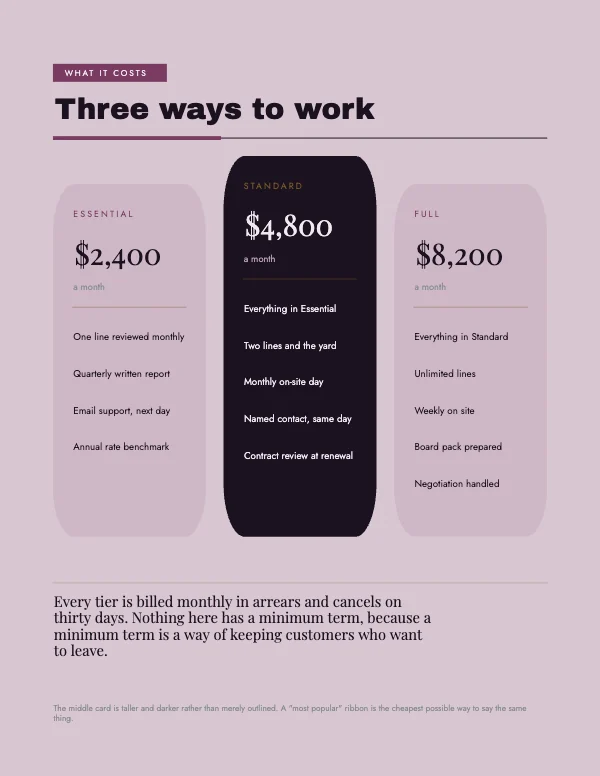 Pricing Tiers BlockPro
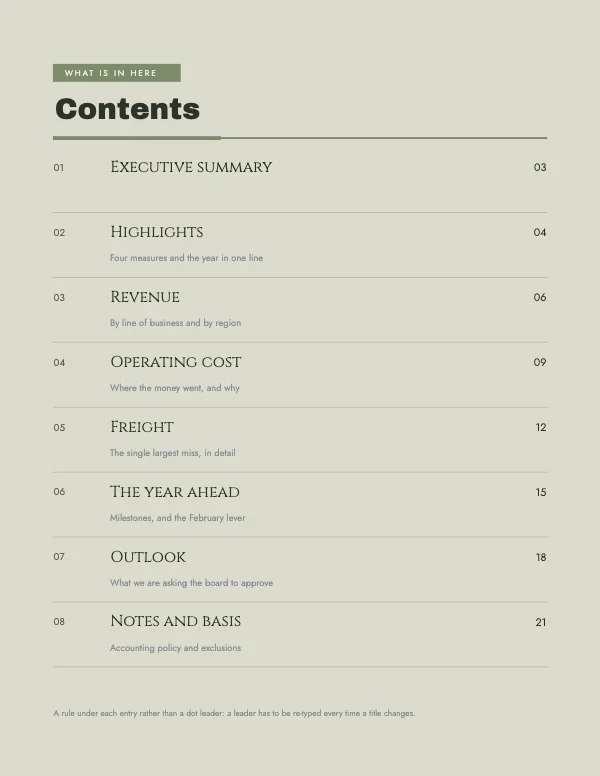 Table of Contents BlockPro
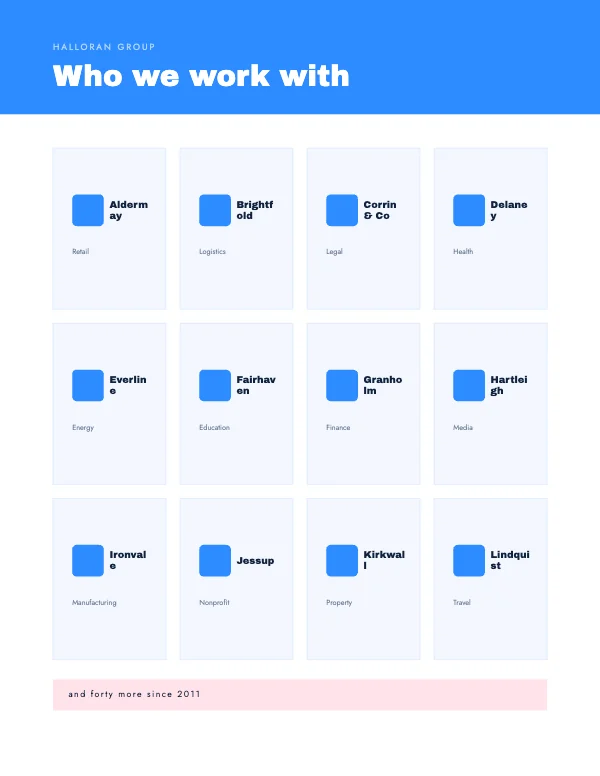 Client Logo Wall BlockPro
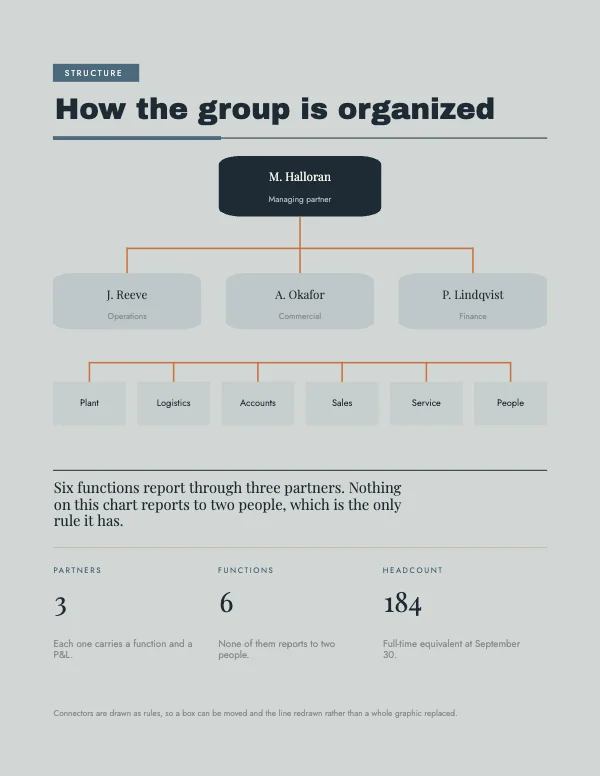 Organization Chart BlockPro
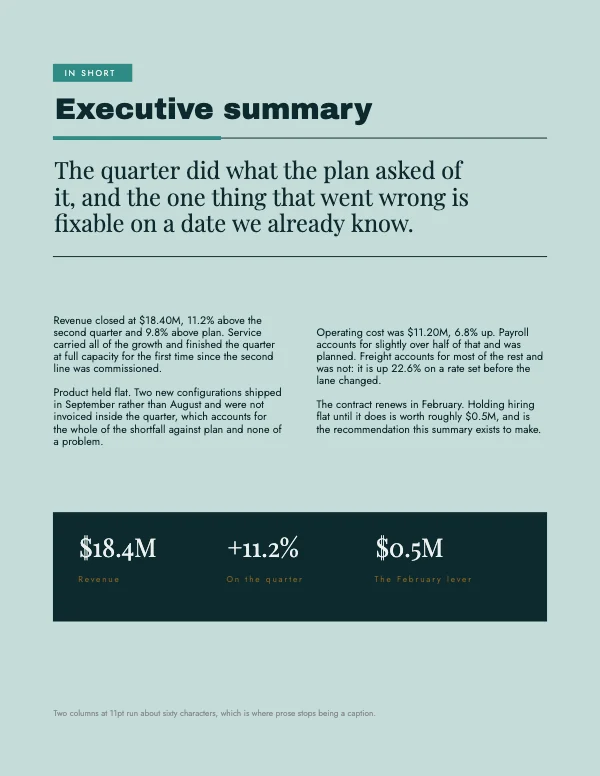 Executive Summary BlockPro
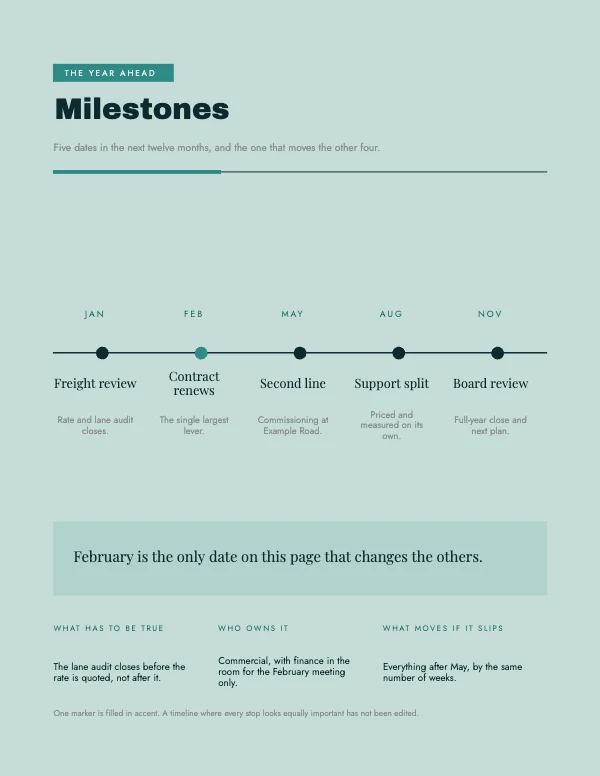 Horizontal Timeline BlockPro
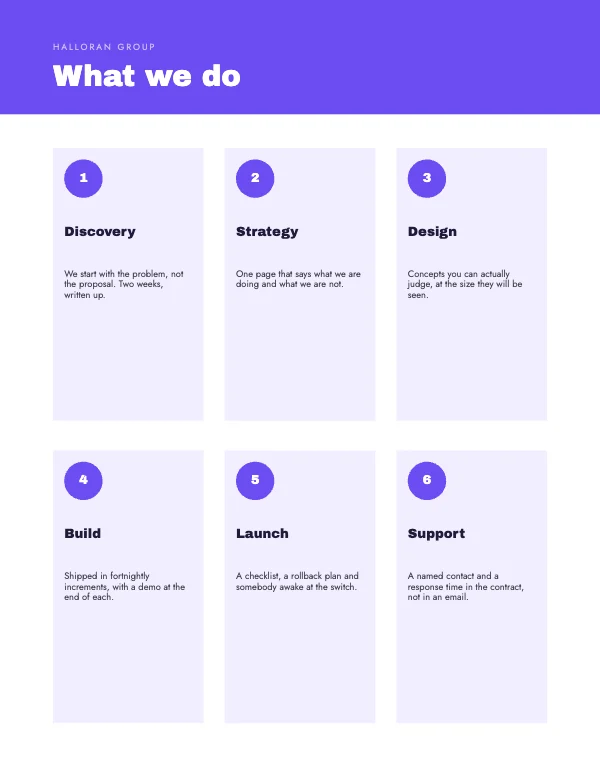 Feature Grid BlockPro
A page, not a document
Every other template on this site is a finished thing. These are not: they are single pages designed to be pasted into a report, a proposal or a deck that already exists and already has a look.
That changes two decisions. There is no photograph anywhere in this set — a stock picture is the fastest way to make an inserted page look inserted. And there is no decorative frame, no masthead and no cover styling, because the document you are adding to already has those and a second set would fight them.
What each page does carry is one structure done properly: a hierarchy that stays aligned when you add a fourth report, a timeline whose spacing does not drift when a milestone is deleted, a SWOT whose four quadrants stay equal when one has more text than the others.
Why these were hard to find until now
Until this page existed, all 16 of these sat under Infographics, and that was our mistake rather than a small one.
An organization chart is not an infographic. Neither is a table of contents, an agenda, or a timeline. Each is its own thing that people look for by its own name, and filing them under a word nobody uses for them meant that somebody searching for exactly what we had built could not find it. The charts stayed where they belong — those genuinely are infographics — and everything that is not a chart is here.
The pages, and what each one is actually for
Organization chart — reporting lines that stay aligned when the team changes shape. The boxes are separate elements, so a layer can be added without redrawing the ones below it.
Timelines, horizontal and vertical. Horizontal for a schedule read left to right in a landscape slot; vertical for a history or a process that runs down a page and has room for a sentence per step. Milestones are individual elements, so removing one does not reflow the rest into a mess.
SWOT grid — four equal quadrants that stay equal. The common failure is one quadrant with six lines and one with two, and a grid that stretches to fit; here the quadrants are fixed and the type is what moves.
Executive summary and headline figure — the page a reader who reads one page will read.
Comparison table — rows and columns as real elements, so a column can be cut without the table losing its alignment.
Agenda, checklist, five-step process — the working pages of a document nobody designs and everybody needs.
Team grid, client logo wall, quote and testimonial — the credibility pages of a proposal.
Pricing tiers and contact and next step — the two pages that decide whether a proposal turns into anything, and the two most often left to the last ten minutes.
Table of contents — leader dots set as type rather than drawn as rows of periods, so retyping an entry keeps the leader reaching the page number.
What this exports, and the honest limit
Crevano writes each page as a lossless 300 DPI image inside a PDF. For a printed report that is excellent — it prints exactly as laid out, with no font substitution and no reflow on somebody else's machine.
It also means the text is not live text. You cannot paste one of these pages into an existing Word or Google Docs file and keep editing it there, and a screen reader cannot read it. If the document has to stay editable in a word processor, build it there and use these as the printed version, or as the page you attach.
Questions
What size are these?
All 8.5 × 11 in portrait at 300 DPI, which is US Letter — the size a report is printed and bound at. No bleed, because a page inside a document is not trimmed at the edge.
Can I use one page on its own?
Yes. A one-page executive summary, a single org chart or a standalone SWOT is a normal use, and nothing in the layout depends on a page before or after it.
Can I combine several into one document?
Yes. Add them as pages in one project and export a single PDF; every page in this set shares the same margins and the same type scale, so a sequence reads as one document rather than as a pile.
Do these have charts in them?
Deliberately not — the ones with real editable charts are on Infographic and chart templates. This set is the structural pages: the hierarchy, the sequence, the grid, the list.
Can I put these into PowerPoint or Google Slides?
You can place the exported image on a slide, and it will look right. You cannot edit the text once it is there. For anything that has to stay editable in another tool, that tool has to build it.
Is there a photograph anywhere in these?
No, on purpose. A drop-in page carrying a stock photograph is the fastest way to make an inserted page look inserted.
Can I use these at work and for clients?
Yes, including for client work and anything internal. No royalty, no credit, and the permission does not expire. That is true on the free plan as well as the paid one, and it stays true if you cancel.
Where to go next
Put together an occasion
Every category
How printing works
Open any of these and it is already the right size. Bleed, margins and trim are set, and there is no watermark on anything you export — on any plan, ever.